|
|
 |
|
|
Predicted Solar Data
Solar Data/Propagation
Click to add to your website
Online Links and Favorites
Of course I think my Solar Widget(s) are the best, but there are other free sources available. You choose which one you like the best.
- Julian (G4ILO) offers an html panel (WebProp) with SN, flux, Indicies, and band conditions.
- Patrick (N0HR) offers a solar panel (PropagationStats) with flux, Indicies, and warnings.
- Kevin (N3KL) offers two status bars for X-ray and Geomag field.
- Anthony (KA9NWM) at wattsupwiththat offers a World Climate Widget with SN, Flux, and solar image.
- Allard (PE1NWL) at DXrobot - Gouda offers five band condition status bars for VHF Aurora, North American 2m Es, and Europe 2/4/6m Es.
- Ansgar (DG2KBC) at Make More Miles on VHF offers three status graphs for EME, Europe Es and Meteor Scatter.
- Elmer (PH5E) at Rig Reference offers a widget that indicates which current HF bands are open.
- Claudio (IW1QLH) at HRDLOG offers a gadget that indicates current HF activity, solar image, solar flux, & sunspot number.
- Derek (W4DTB) at OCRA offers a gadget that uses the N0NBH xml file to create a text and image gadget similar to what I offer from a php file. You can download the Source and some examples, along with the readme file from the following link.
<
- Marv (W4ZD) offers a gadget that uses the N0NBH xml file to create an html color coded band conditions chart. Click the following link, and follow the instructions.
p>
Misc Ham
NASA/JPL Favorites
|
 |
|
HF Propagation Tools and Solar Data are now on multiple pages for faster loading
- Use the buttons at the top and bottom of the page to navigate, or use the following links:
- For Solar-Terrestrial Data banners and widgets (both web page and devices) click here
- For Online MOF/LOF HF Propagation Prediction Tool, and conversion tools click here
- For NOAA's SWPC WSA-Enlil Coronal Mass Ejection (CME) Solar Wind Prediction Model click here
- For current Space Weather and HF Propagation Conditions, and MUF Maps click here
- pdf presentation that contains all the information on this entire webpage, including all the tutorials. You can download from this link
- pdf presentation that contains detailed instructions on adding a banner to your www.qrz.com BIO page. You can download from this link
Understanding/Using the Data and Images from the Sun
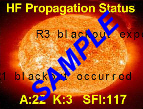
Understanding/Using Solar-Terrestrial Data from the Solar Data Panel(s)
- Most of us understand the impacts of Solar Flux/Sun Spots have on HF communications, but some are unsure about the remaining data provided in the panel.
- I have created an easy to understand abbreviated table below that provides HF Propagation conditions based on the current Solar-Terrestrial Data. Factors provided include background X-Ray, Proton Flux, and K index (including the nT measurement), Solar Flux Index (SFI), Sunspots (SN), Electron Flux, and Aurora (includes Normalization factor (n) less than 2.0 = high confidence, greater than 2.0 = low confidence).
- Because some items are better when high, and others low, I have color coded the blocks. Green is best contitions, yellow marginal, red unacceptable.
- A printable page (best using landscape) is also provided for ease of use in the shack. This single page easy to understand table is a must for any HAM operator (with a memory as bad as mine has gotten).
- Note that I will be adding how to use the 304A data to the page in the near future.
- I added Solar Wind and Bz component to the table.
 Click for printable Solar events page Click for printable Solar events page
HF & VHF Propagation Conditions based on Current Solar-Terrestrial and other Data
| Current Solar-Terrestrial Data |
Category |
Radio Blackouts
Use X-Ray |
Solar Radiation Storms
Use Proton Flux |
Geomagnetic Storms
Use K-Index/K-nT/ Aurora/Solar Wind/Bz |
Band Openings
Use Solar Flux (SN) |
Electron Alert
Use Electron Flux |
 |
Extreme |
X20 (1 per cycle)
Complete HF blackout on entire sunlit side lasting hours |
1000000 (1 per cycle)
Complete HF blackout in polar regions |
K=9 (nT=>500) [Aur=10++] (SW=>800) [Bz=-40 -50]
(4 per cycle)
HF impossible. Aurora to 40°. Noise S30+. |
200-300 (SN=160-250)
Reliable communications all bands up through 6m |
>1000 Alert
Partial to complete HF blackout in polar regions |
| Severe |
X10 (8 per cycle)
HF blackout on most of sunlit side for 1 to 2 hours |
100000 (3 per cycle)
Partial HF blackout in polar regions |
K=8 (nT=330-500) [Aur=10+] (SW=700-800) [Bz=-30 -40] (100 per cycle)
HF sporadic. Aurora to 45°. Noise S20-S30. |
| Strong |
X1 (175 per cycle)
Wide area HF blackout for about an hour on sunlit side |
10000 (10 per cycle)
Degraded HF propagation in polar regions |
K=7 (nT=200-330) [Aur=10] (SW=600-700) [Bz=-20 -30]
(200 per cycle)
HF intermittent. Aurora to 50°. Noise S9-S20. |
150-200 (SN=105-160)
Excellent conditions all bands up through 10m w/6m openings |
| Moderate |
M5 (350 per cycle)
Limited HF blackout on sunlit side for tens of minutes |
1000 (25 per cycle)
Small effects on HF in polar regions |
K=6 (nT=120-200) [Aur=9] (SW=500-600) [Bz=-10 -20]
(600 per cycle)
HF fade higher lats. Aurora to 55°. Noise S6-S9. |
120-150 (SN=70-105)
Fair to good conditions all bands up through 10m |
<1000 Active
Degraded HF propagation in polar regions |
| Minor |
M1 (2000 per cycle)
Occasional loss of radio contact on sunlit side |
100 (50 per cycle)
Minor impacts on HF in polar regions |
K=5 (nT=70-120) [Aur=8] (SW=400-500) [Bz=0 -10]
(1700 per cycle)
HF fade higher lats. Aurora to 56°. Noise S4-S6. |
90-120 (SN=35-70)
Fair conditions all bands up through 15m |
<100 Active
Minor impacts on HF in polar regions |
| Active |
C1 Moderate Flare
Low absorption of HF signals |
10 Active
Very minor impacts on HF in polar regions |
K=3-4 (nT=20-70) [Aur=6-7] (SW=200-400) [Bz=0-+50] Unsettled/Active
Minor HF fade higher lats. Aurora 60-58°. Noise S2-S3. |
70-90 (SN=10-35)
Poor to fair conditions all bands up through 20m |
<10 Normal
No impacts on HF |
| Normal |
A1-B9 No/Small Flare
No or very minor impact to HF signals |
1 Normal
No impacts on HF |
K=0-2 (nT=0-20) [Aur=<5] (SW=200-400) [Bz=0-+50] Inactive/Quiet
No impacts on HF. Aurora 67-62°. Noise S0-S2. |
64-70 (SN=0-10)
Bands above 40m unusable |
<1 Normal
No impacts on HF |
VHF Conditions
Aur Lat (Auroral Latitude): Indicates lowest latitude from the current Aurora Activity measurement. Text color coded for low activity, hi-latitude, & mid-latitude.
Aurora (Northern Auroral Activity): Band Closed = No/Low Auroral activity. High LAT AUR = Auroral activity >60°N. MID LAT AUR = Auroral activity 60° to 30°N.
EsEU (Sporadic E - Europe): Band Closed = No Sporadic E (ES) activity. High MUF (2M only) = Cond support 2M ES 50/70/144MHz ES = Respective band open
EsNA (Sporadic E - North America): Band Closed = No Sporadic E (ES) activity. High MUF = Cond support 2M ES 144MHz ES = ES reported @ 2M
EME (Earth-Moon-Earth): Current EME degradation. Very Poor (>5.5dB), Poor (4dB), Moderate (2.5dB), Good (1.5dB), Very Good (1dB), Excellent (<1dB).
Solar Flare Probability: Provides the probability of a solar flare (in %) for the net 24 hours.
MUF (Max Usable Frequency Bar Color): No Sporadic E (ES) activity / ES reported @ 6M / ES reported @ 4M / Cond support 2M ES / ES reported @ 2M
MS (Meteor Scatter) Activity Color bar: Provides meteor activity color coded MIN to MAX conditions (see the graph below the bar).
©N0NBH Paul L Herrman 2011 |
Understanding HF/VHF/UHF/SHF Propagation relative to Guided Wave, Ground Wave, Direct Wave, Ionosphere, Troposphere, Aurora, Meteor Scatter, and Earth-Moon-Earth (EME or Moon Bounce)
- OK ,the instructor profession in me comes out. The images provided are my attempt at describing how solar/weather/auroral/meteor/EME conditions impact VLF/LF/MF/HF/VHF/UHF/SHF propagation.
- Each selectable item below is a complete tutorial on the subject, each on a single image, and in easy to understand terms.
- Select desired plot from box. Page refresh updates all images at once.
Click for printable Glossary of terms page
Glossary of terms for the data available in the N0NBH solar banners
| Item |
Element |
Description |
| SFI |
Solar Flux Index |
DRAO Penticton no longer available, using NOAA data. Intensity of solar radiation measured at 2800MHz (10.7cm). Good indication of the F layer ionization (layer that
gives us most of our DX on HF). The higher the number, the greater the level of ionization is, and the higher the frequency. Measured once daily. Note that NOAA recorded SFI
for the day is the 2nd (or middle) of the DRAO readings. SFI does correlate to 304A (see graph below). |
SN
| Sunspot Number
| Sunspot Number provided by NOAA is a reported value from 0 to 250. It is computed using a formula [R=k (10g+s)] by Rudolph Wolf in 1848, where R is the sunspot number;
g is the number of sunspot groups on the solar disk; s is the total number of individual spots in all the groups; and k is a variable scaling factor (usually less than 1) that
accounts for observing conditions and the type of observing device. NOAA SN does loosely correlate to SFI. Updated once daily. |
SNeX
| NWRA Effective Smoothed Sunspot Number
| Three measurements are available for this parameter calculated by NorthWest Research Associates, Inc. The NWRA values (used with permission) are available
for Global (SNeG), Northern Hemisphere (SNeN) and Southern Hemisphere (SNeS) and are calculated using foF2 data from NOAA/NCEI. In addition, the color of the
label (SNeX) determines the validity of the data (last f0f2 observations from NOAA). Green SNeX = no more than 1 hour ago.
Yellow SNeX = no more than 4 hours ago. Orange SNeX = no more than 12 hours ago. Red SNeX
= more than 12 hours ago. They are updated once every hour. See NWRA site for a in depth background
on the SSNe parameter. |
| A
| Planetary A Index
| NOAA reported value from 0 to 400. Provides a daily average level for geomagnetic activity. Uses the average of eight 3 hour K-Index values (magnetic value measured in nanotesla or nT) to provide the level of instability in the earth’s geomagnetic field. When used with K-Index: Both high indicates geomagnetic field is unstable, and HF signals are prone to sudden fades, and some paths may close while others open up abruptly and with little warning. High K index/Low A indicates a sudden, abrupt disturbance in the geomagnetic field, which can cause an intense but brief disruption in HF propagation, but can cause an auroral event. Updated once daily. |
| K
| Planetary K Index
| NOAA reported value from 0 to 9. Measures disturbances in the horizontal component of earth's magnetic field. Value in nT is measured using a magnetometer during a three-hour interval, and then converted to a factor. Use with A-Index – sees above to determine HF conditions. Updated eight times daily. |
| X-Ray or XRY
| Hard X-Rays
| NOAA reported value from A0.0 to X9.9. Intensity of hard x-rays hitting the earth’s ionosphere. Impacts primarily the D-layer (HF absorption). The letter indicates the order of magnitude of the X-rays (A, B, C, M and X), where A is the lowest. The number further defines the level of radiation. Updated eight times daily. |
| 304A
| 304 Angstroms
| NOAA reported value from 0 to unknown. Relative strength of total solar radiation at a wavelength of 304 angstroms (or 30.4 nm), emitted primarily by ionized helium in the sun's photosphere. Two measurements are available for this parameter, one measured by the Solar Dynamics Observatory, using the EVE instrument, and the other, using data from the SOHO satellite, using its SEM instrument. Responsible for about half of all the ionization of the F layer in the ionosphere. 304A does correlate to SFI (see graph below). Updated hourly. |
| Pnt Flx or PF
| Proton Flux
| NOAA reported value from 0 to unknown. Density of charged protons in the solar wind. The higher the numbers, the more the impact the ionosphere. Primarily impacts the E-Layer of the ionosphere. Updated hourly. |
| Elc Flx or EF
| Electron Flux
| NOAA reported value from 0 to unknown. Density of charged electrons in the solar wind. The higher the numbers (>1000), the more the impact the ionosphere. Primarily impacts the E-Layer of the ionosphere. Updated hourly. |
| Aur
| Aurora
| Data is now calculated from the current hemispheric power value (0-150 GW) to give the old reported scaled factor value from 0 to 10++. Indicates how strong the F-Layer ionization is in the polar regions. Higher values cause auroral events (including northern/southern lights) to move to lower latitude. Updated every 15 minutes. |
| n
| Normalization
| Always 1.99 now that Aur is calculated. Will be removed on the next major banner update. |
| Bz
| Bz Component
| ACE Satellite reported value from +50 to -50. Strength and direction of the interplanetary magnetic field as impacted by solar activity. Positive is same direction as the earth's magnetic field, and negative is the opposite magnetic polarity. Cancels out earth’s magnetic field when negative, which increases the impact of solar particles in the ionosphere. Updated hourly. |
| SW
| Solar Wind
| ACE Satellite reported value from 0 to 1000. Speed (kilometers per second) of the charged particles as they pass earth. The higher the speed, the greater the pressure is exerted on the ionosphere. Values greater than 500 km/sec have impact on HF communications. Updated hourly. |
| Aur Lat
| Aurora Latitude
| Calculated value from 67.5 to <45.0. Calculation from NOAA utilizes the current Aurora measurement. Used to estimate the lowest latitude impacted by the auroral event. Updated every 15 minutes. |
| Aur
| Aurora
| DX-Robot reported event (used with permission). Reports Band Closed for No/Low Auroral activity, High LAT AUR for Auroral activity >60°N, or MID LAT AUR for Auroral activity from 60° to 30°N. Updated every ½ hour. |
| EsEU
| Sporadic E Europe
| DX-Robot reported event (used with permission). Reports Band Closed, High MUF when 2M only is open, or 50/70/144MHz ES when the respective band is reported open. Updated every ½ hour. |
| EsNA
| Sporadic E North America
| DX-Robot reported event (used with permission). Reports Band Closed, High MUF when conditions support Es, and 144MHz ES when the band is reported open. Updated every ½ hour. |
| EME Deg
| Earth-Moon-Earth Degradation
| Make More Miles reported value (used with permission). Reports EME path attenuation as Very Poor (>5.5dB), Poor (4dB), Moderate (2.5dB), Good (1.5dB), Very Good (1dB), Excellent (<1dB). Updated every ½ hour. |
| Solar Flare Prob
| Solar Flare Probability
| University of Bradford predicted value (used with permission). Reports the probability (in %) of a solar flare within the next 24 hours (0-100%). Updated every hour. |
| MUF
| Maximum Usable Frequency
| Make More Miles reported value (used with permission). Provides the Maximum Usable Frequency in a colored bar. Gray indicates No Sporadic E
(ES) activity , blue indicates ES reported @ 6M, green indicates ES reported @ 4M, yellow indicates conditions support 2M ES,
and red indicates reported @ 2M. Updated every ½ hour. |
| MS
| Meteor Scatter Activity Bar
| Make More Miles reported value (used with permission). Provides the Meteor Scatter activity in a colored bar. Gray indicates no activity. See the color coded graph at the bottom of the bar for activity level. Updated every 1/4 hour. |
| GeoMag Fld
| Geomagnetic Field
| Calculated value. Indicates how quiet or active the earth's magnetic field is based on the K-Index value. Reports as Inactive, Very Quite, Quiet, Unsettled, Active, Minor Storm, Major Storm, Severe Storm, or Extreme Storm. Higher indications can cause HF blackouts and auroral events. Updated every three hours. |
| Sig Noise Lvl
| Signal Noise Level
| Calculated value. Indicates how much noise (in S-units) is being generated by interaction between the solar wind and the geomagnetic activity. A more active and disturbed solar wind, the greater the noise. Updated every ½ hour. |
MUF
| Maximum Usable Frequency
| NOAA reported value from 0 to 100MHz. Provides the maximum usable frequency in MHz at one of 11 locations worldwide. Updated every 15 minutes. |
|
| CME
| Coronal Mass Ejection
| NOAA/SWPC predicted date and time (in UTC). Provides the date and time of a predicted earth bound CME event. Color coded for severity, where green
is minor, yellow is moderate, and red is severe. Updated when predictions are received from NOAA/SWPC. |
©N0NBH Paul L Herrman 2012 |
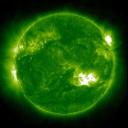
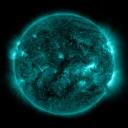
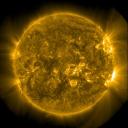
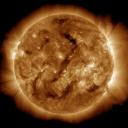
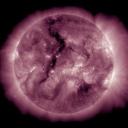
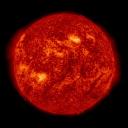
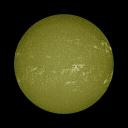
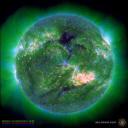
Understanding the Solar Images that are available in the Solar Data Panels
- Other than just choosing your favorite color for the image displayed in the Solar data panel, what are we actually seeing when we observe the various solar images?
|
 |
|
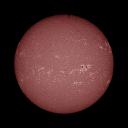
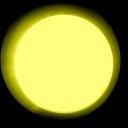
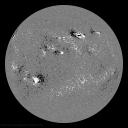
- Select "Parts of the Sun" image from the choices above, and use the table below that shows each image that you can display in the image solar panels, with an explanation of each of the spectral lines (elements) and characteristics.
|
- Courtesy of SDO (NASA) and the AIA consortium. I added the SDO images to the selectable images banner. Boy, these are GREAT! See the table below for the ?image= parameter. SDO is much better than SoHo, it's amazing! Refer to the HAMQSL FAQ Page for complete modification instructions and examples.
- I added the Nobeyama Radioheliograph 17 GHz image (?image=norh_17ghz).
Click for printable Solar Image Explanation Card
Understanding Solar Images available in the N0NBH solar banners
| SoHo/SDO/Other Image |
?image=
Å
nm
Spectral Line & Ionization |
TempK
TempºC
TempºF
Best used to see |
SDO/Other Image |
?image=
Å
nm
Spectral Line & Ionization |
TempK
TempºC
TempºF
Best used to see |
SDO/Other Image |
?image=
Å
nm
Spectral Line & Ionization |
TempK
TempºC
TempºF
Best used to see |
 |
vsm1
6302 Å
630.2 nm
Iron (Fe) 0 times ionized |
5,800K
5,527ºC
9,980ºF
Photosphere, sunspots |
 |
vsm2
8542 Å
854.2 nm
Calcium (Ca) 1 times ionized |
10,000K
9,727ºC
17,540ºF
Photosphere, Chromosphere, sunspots |
 |
corona
9500 Å
950 nm
White Light |
2,000,000K
1,999,727ºC
3,599,540ºF
Corona |
 |
c2
NA
NA
White Light |
2,000,000K
1,999,727ºC
3,599,540ºF
Corona, CME, Flare |
 |
c3
NA
NA
White Light |
2,000,000K
1,999,727ºC
3,599,540ºF
Corona, CME, Flare |
 |
sh
10830 Å
1083 nm
Helium (He) 0 times ionized |
20,000K
19,727ºC
35,540ºF
Chromosphere, Tran-reg, sunspots, Granules |
 |
ha
6562.8 Å
656.28nm
Hydrogen (H) Hα-Line |
20,000K
19,727ºC
35,540ºF
Chromosphere, Tran-reg, sunspots, flares |
 |
norh_17ghz
17 GHz
17647 μm
Radio Interferometer |
N/A
N/A
N/A
Photosphere, sunspots, flares |
 |
mdi
6767 Å
676.7 nm
Nickel (Ni) 0 times ionized |
6,000K
5727ºC
10,340ºF
Photosphere, sunspots |
 |
mag
Magnetogram
N/A
N/A
N/A |
N/A
N/A
N/A
Sunspots |
 |
sdo_094
94 Å
9.4 nm
Iron (Fe) 17 times ionized |
9,000,000K
9,000,000ºC
16,000,000ºF
Flaring regions |
 |
sdo_131
131 Å
13.1 nm
Iron (Fe) 7/19/22 times ionized |
1,000,000K
999,727ºC
1,799,540ºF
Flaring regions |
 |
sdo_171
171 Å
17.1 nm
Iron (Fe) 8 times ionized |
1,000,000K
999,727ºC
1,799,540ºF
Quiet corona, upper transition region |
 |
sdo_193
193 Å
19.3 nm
Iron (Fe) 11/23 times ionized |
1,500,000K
1,499,727ºC
2,699,540ºF
Corona and hot flare plasma |
 |
sdo_211
211 Å
22.1 nm
Iron (Fe) 13 times ionized |
2,000,000K
1,999,727ºC
3,599,540ºF
Active-region corona |
 |
sdo_304
304 Å
30.4 nm
Helium (He) 1 times ionized |
80,000K
79,727ºC
143,540ºF
Chromosphere, transition region |
 |
sdo_335
335 Å
33.5 nm
Iron (Fe) 15 times ionized |
5,000,000K
5,000,000ºC
9,000,000ºF
Active-region corona |
 |
sdo_1600
1600 Å
160.0 nm
Carbon (C) 3 times ionized |
Unknown
Transition region, upper photosphere |
 |
sdo_1700
1700 Å
170.0 nm
Continuum |
Unknown
Temperature minimum, photosphere |
 |
sdo_4500
4500 Å
450.0 nm
White Light |
2,000,000K
1,999,727ºC
3,599,540ºF
Photosphere |
 |
sdo_mag1
Magnetogram
N/A
N/A
N/A |
N/A
N/A
N/A
Sunspots |
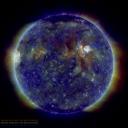 |
sdo_comp1
211/193/
171 Å
Composite Image |
Unknown
See above |
 |
sdo_comp2
304/211/
171 Å
Composite Image |
Unknown
See above |
 |
sdo_comp3
94/193/
335 Å
Composite Image |
Unknown
See above |
 |
sdo_comp4
170/171 Å
HMI Mag
Composite Image |
Unknown
See above |
©N0NBH Paul L Herrman 2011 |
2010 Solar Forecast Whitepaper
- Courtesy of Jerry (VE6TL), here is a white paper describing the forecast for the remainder of Solar Cycle 24, and peak of Solar Cycle 25 in 2024.
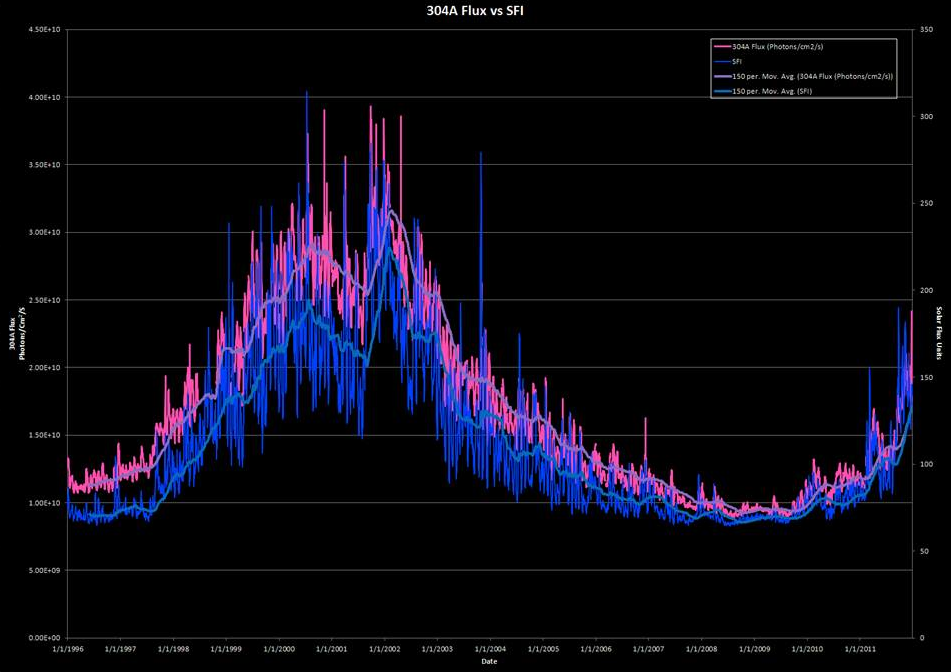
1996-2012 Comparison of SoHo SEM 304A Data to SFI
- Courtesy of Jerry (VE6TL).
- Data from SOHO's/NOAA's database and graphed 304A flux versus SFI over a 16 year period. Overall, there appears to be good agreement in the two measurements.
- One of the interesting differences in the two curves is the differential. It started out consistent for the first 5 years, then widened after the
first peak (2001), broadened, and narrowed considerably at the maximum (2002-3). Since then it has been narrowing until the two curves essentially track each other
(since 2009). N0NBH comment - I believe this may be the SEM sensor degrading over time.
|
|


 8 Nov 2023