Paul L Herrman
Sierra Vista, Arizona USA (DM41um)
Space Weather, Conditions, & MUF
UTC:
n0nbh@n0nbh.com
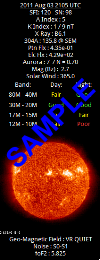
Predicted Solar Data
Solar Data/Propagation
Click to add to your website
Online Links and Favorites
Of course I think my Solar Widget(s) are the best, but there are other free sources available. You choose which one you like the best.
Julian (G4ILO) offers an html panel (WebProp) with SN, flux, Indicies, and band conditions.
Patrick (N0HR) offers a solar panel (PropagationStats) with flux, Indicies, and warnings.
Kevin (N3KL) offers two status bars for X-ray and Geomag field.
Anthony (KA9NWM) at wattsupwiththat offers a World Climate Widget with SN, Flux, and solar image.
Allard (PE1NWL) at DXrobot - Gouda offers five band condition status bars for VHF Aurora, North American 2m Es, and Europe 2/4/6m Es.
Ansgar (DG2KBC) at Make More Miles on VHF offers three status graphs for EME, Europe Es and Meteor Scatter.
Elmer (PH5E) at Rig Reference offers a widget that indicates which current HF bands are open.
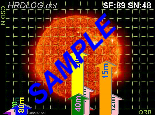
Claudio (IW1QLH) at HRDLOG offers a gadget that indicates current HF activity, solar image, solar flux, & sunspot number.
Derek (W4DTB) at OCRA offers a gadget that uses the N0NBH xml file to create a text and image gadget similar to what I offer from a php file. You can download the Source and some examples, along with the readme file from the following link.
Marv (W4ZD) offers a gadget that uses the N0NBH xml file to create an html color coded band conditions chart. Click the following link, and follow the instructions.
HF Propagation Tools and Solar Data are now on multiple pages for faster loading
Use the buttons at the top and bottom of the page to navigate, or use the following links:
For Solar-Terrestrial Data banners and widgets (both web page and devices) click here
For Online MOF/LOF HF Propagation Prediction Tool, and conversion tools click here
For NOAA's SWPC WSA-Enlil Coronal Mass Ejection (CME) Solar Wind Prediction Model click here
For Understanding/Using Solar-Terrestrial Data, Solar Images, and HF Tutorials click here
pdf presentation that contains tutorials and information on understanding radio propagation, and how to use all the data contained in the solar panels. You can download from this link
pdf presentation that contains detailed instructions on adding a banner to your www.qrz.com BIO page. You can download from this link
Select desired item from box. Page refresh updates all images at once.
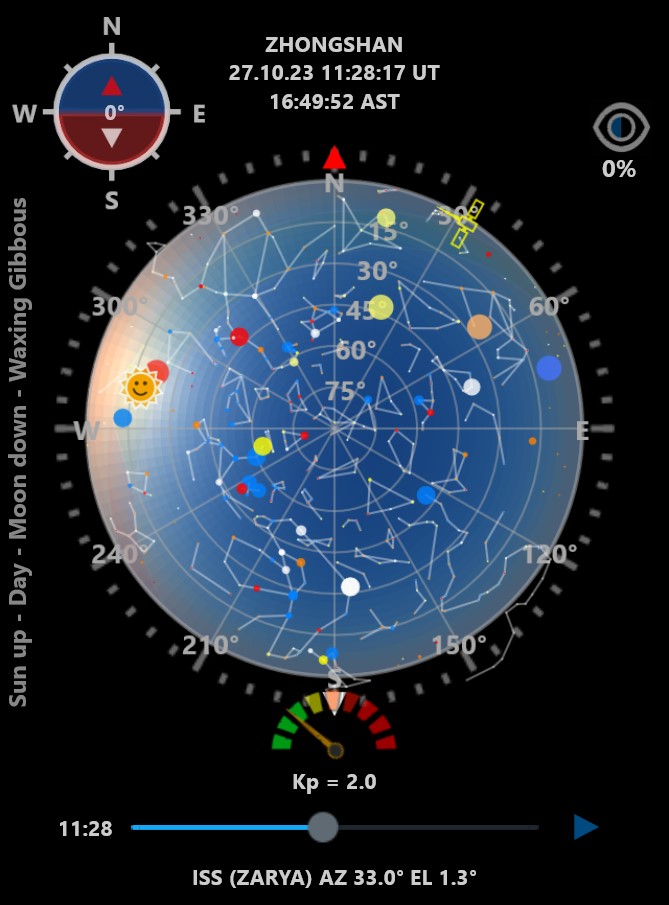
On the dial background color schemes, green indicates that values in this range are unlikely to disturb the near-Earth space environment. Yellow indicates that values in this range may contribute to disturbances, and Red indicates that values in this range are likely to drive disturbances. This scheme is valid for all dials except the "Log[Beta]" dial
Last 30 days of Solar-Terrestrial Activity based on data from sunspot groups and solar flares, solar wind data from ACE, geosynchronous observation from GOES satellite, and K index from Kakioka magnetic observatory.


 8 Nov 2023