
|
|
TYPE
|
PANEL
|
HTML CODE
|
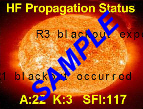
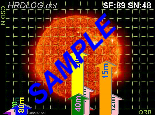
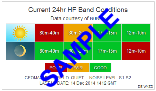
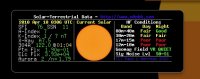
HF & VHF
Selectable SN
Selectable 304A
Band
Condition
Calculations
EME Deg
Selectable MUF
Horizontal
Selectable
Solar Images
Black Only
No Transparent
|
|
|
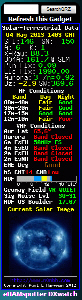
No Band
Condition
Calculations
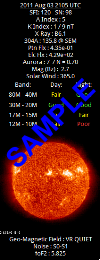
Large Vertical
Selectable 304A
19 Selectable
Solar Images
Black Only
No Transparent
|
|
|
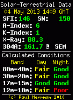
HF & VHF
Band
Condition
Calculations
Large Vertical
Selectable 304A
EME Deg
Selectable MUF
Black Only
No Transparent
|
|
|
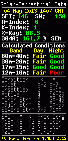
No Band
Condition
Calculations
Small Vertical
Selectable 304A
Multi-Color
& Transparent
|
|
|
No Band
Condition
Calculations
Small Vertical
Selectable 304A
Multi-Color
& Transparent
|
|
|
No Band
Condition
Calculations
Small Vertical
Limited Data
Multi-Color
& Transparent
|
|
|
Only Band
Condition
Calculations
Small Vertical
Multi-Color
& Transparent
|
|
|
Band
Condition
Calculations
Small Vertical
Selectable 304A
Multi-Color
& Transparent
|
|
|
Band
Condition
Calculations
Large Vertical
Selectable 304A
Multi-Color
& Transparent
|
|
|
No Band
Condition
Calculations
Horizontal
Selectable 304A
19 Selectable
Solar Images
Black Only
No Transparent
|
|
|
Band
Condition
Calculations
Selectable
Europe K-Ind
tromso &
dombas
Selectable 304A
19 Selectable
Solar Images
Black Only
No Transparent
|
|
|
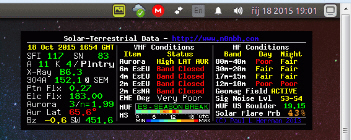
HF & VHF
Selectable
Europe K-Ind
tromso &
dombas
Selectable 304A
Band
Condition
Calculations
EME Deg
Selectable MUF
Horizontal
Black Only
No Transparent
|
|
|
HF & VHF
Selectable
Europe K-Ind
tromso &
dombas
Selectable 304A
Band
Condition
Calculations
EME Deg
Selectable MUF
Horizontal
Black Only
No Transparent
|
|
|
HF & VHF
Selectable
Europe K-Ind
tromso &
dombas
Selectable 304A
Band
Condition
Calculations
EME Deg
Selectable MUF
Horizontal
19 Selectable
Solar Images
Black Only
No Transparent
|
|
|
Band
Condition
Calculations
Selectable
Europe K-Ind
tromso &
dombas
Selectable 304A
Multi-Color
& Transparent
|
|
|
No Band
Condition
Calculations
Horizontal
Selectable 304A
19 Selectable
Solar Images
Black Only
No Transparent
|
|
|
No Band
Condition
Calculations
Horizontal
304A @ EVE only
Solar Flux
Sunspot No.
Graph
Last 30 days
Black Only
No Transparent
|
|
|
No Band
Condition
Calculations
Horizontal
171A & 304A
@ EVE only
Solar Flux
Sunspot No.
11 MUF
readings
Graph
Last 30 days
Black Only
No Transparent
|

|
|
No Band
Condition
Calculations
Horizontal
Selectable 304A
Current World
Sunlight Map
Solar Flux
Sunspot No.
11 MUF
readings
Black Only
No Transparent
|
|
|
No Band
Condition
Calculations
Selectable 304A
Current World
Sunlight Map
No Color
No Transparent
|
|
|
No Band
Condition
Calculations
Selectable 304A
Current World
Sunlight Globe
No Color
No Transparent
|

|
|
No Band
Condition
Calculations
Selectable 304A
Current World
Moon View
of Globe
EME Deg
No Color
No Transparent
|

|
|
No Band
Condition
Calculations
Selectable Image
Selectable 304A
Current Solar
System View
No Color
No Transparent
|
|
|
|
|


 8 Nov 2023


 Add Solar-Terrestrial Data to your Apple iPhone or iPad
 Click to subscribe to an
  Click to subscribe to an